
Interested in learning quantum computing? Take a look at our new textbook Introduction to Quantum Computing with Qiskit.
Introduction
In this tutorial we will explore Rabi oscillations and how to model them on IBM quantum computers with Qiskit.
A Rabi oscillation is where a two level quantum system constantly oscillates between it’s ground state and an excited due to a driving field. For example when under exposure from a laser an atom will emit and absorb photons at a steady pace.
In quantum computing however Rabi oscillations are where a qubit will cycle between |0〉and |1〉

Implementation
In Qiskit Rabi oscillations can be modelled very easily using an RX gate. This gate rotates the state around the X axis by a rotation angle denoted as theta (θ).
For more information on the RX gate check out our tutorial on implementing the RX in Qiskit: https://quantumcomputinguk.org/tutorials/introduction-to-the-rx-gate-with-code
The operation of the RX gate is described using the following matrix:
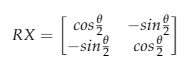
Where theta (θ) is the rotation angle.
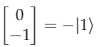
Using matrix multiplication we can see how the RX gate operates on the qubits state. For our first example lets initialise the qubits state to |0〉 and set θ to be π. Then we multiply the associated column vector for |0〉with the RX matrix. This should flip the qubits state from |0〉to −|1〉
The associated column vector for |0〉is:

Then multiply the column vector by the RX matrix:
Note that if θ=0 there will be no rotation and thus the qubit will remain |0〉. If the θ=π/2 then the qubit will be in a superposition of |0〉and |1〉and if θ=π then the qubit will be -|1〉. If θ is increased from π towards 2(π) the measurements for |0〉will again increase.
As the rotation angle is increased the qubit will repeatedly oscillate between |0〉and -|1〉Thus using the RX gate we can model Rabi oscillations quite easily. It is important to note however that when measuring a qubit -|1〉will be measured as |1〉.
In the program below a circuit is implemented that applies an RX gate to 1 qubit and then measured. This circuit is repeated for varying rotation angles starting from θ=0 to 2(π) with θ increased by π/8 each time. The measurements for |0〉and |1〉are then plotted and the optimal rotation angles corresponding to the highest measurements for |0〉and |1〉recorded.
How to run the program
Copy and paste the code below in to a python file
Enter your API token in the IBMQ.enable_account('Insert API token here') part
Save and run
Code
from qiskit import QuantumRegister, ClassicalRegister
from qiskit import QuantumCircuit, execute,IBMQ
from qiskit.tools.monitor import job_monitor
import numpy
import matplotlib.pyplot as plt

pi = numpy.pi

IBMQ.enable_account('ENTER API KEY HERE')
provider = IBMQ.get_provider(hub='ibm-q')

backend = provider.get_backend('ibmq_armonk')

q = QuantumRegister(1,'q')
c = ClassicalRegister(1,'c')

phi = 0

a = []
b = []

xticks = []
qc_list = []

while phi <= 2*pi:

    xticks.append(phi)

    circuit = QuantumCircuit(q,c)
    circuit.rx(phi,q[0]) #RX gate where Phi is the rotation angle
    circuit.measure(q,c) # Qubit Measurement

    qc_list.append(circuit)

    phi += pi/8

job = execute(qc_list, backend, shots=8192)

job_monitor(job)
counts = job.result().get_counts()

highest_count1 = 0
highest_count1_1 = 0
highest_count1_0 = 0
index1 = 0

highest_count0 = 0
highest_count0_1 = 0
highest_count0_0 = 0
index0 = 0

for count in counts:
    a.append(count['0'])
    b.append(count['1'])

    if count['1'] > highest_count1:
        highest_count1 = count['1']
        index1 = counts.index(count)
        highest_count1_1 = count['1']
        highest_count1_0 = count['0']

    if count['0'] > highest_count0:
        highest_count0 = count['0']
        index0 = counts.index(count)
        highest_count0_1 = count['1']
        highest_count0_0 = count['0']


print("\nOptimal rotation angle for '1' is: ", xticks[index1], ", Counts: 0:", highest_count1_0,  "1:", highest_count1_1)
print("Optimal rotation angle for '0' is: ", xticks[index0], ", Counts: 0:", highest_count0_0,  "1:", highest_count0_1)

plt.suptitle('Rabi Oscillations on IBMQ Armonk')
plt.plot(xticks,a)
plt.plot(xticks,b)
plt.legend(["Measurements for '0' ", "Measurements for '1'"])
plt.show()
Output

Output showing the optimal rotation angles for ‘1’ and ‘0’ respectively.
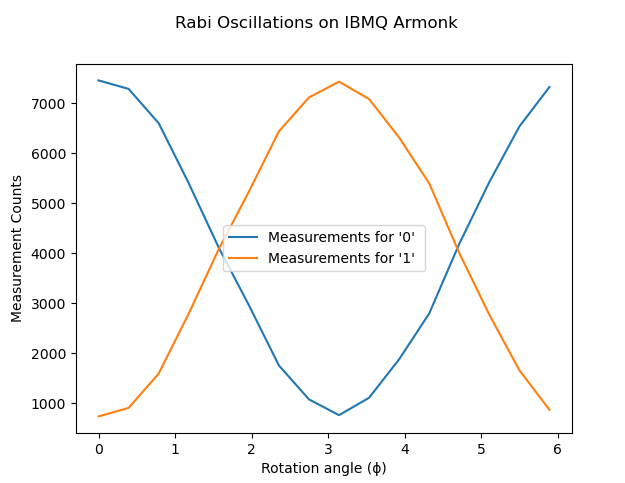
Rabi oscillation when the program is ran on IBMQ Armonk