Interested in learning how to program quantum computers? Then check out our Qiskit textbook Introduction to Quantum Computing with Qiskit.
Introduction
In this tutorial we will explore how to model different probability distributions on IBMs quantum devices in Qiskit.
What are probability distributions?
Probability distributions are functions that give the probability of a given variable. In this tutorial we will look at 3 probability distributions:
Normal Distribution
Log-Normal Distribution
Uniform Distribution
Normal Distribution
The normal distribution is a distribution that gives the probability of real random variables that are normally distributed. It also called the bell curve given its shape when plotted on a graph.
It can be defined as:

Where Mu is the mean and sigma is the standard deviation.
When plotted the distribution looks like this:

Plot of the normal distribution for different values of mu and sigma. Source: https://commons.wikimedia.org/wiki/File:Normal_Distribution_PDF.svg
Uniform Distribution
The uniform distribution is a function where all random variables are equally probable within a certain range. It can be defined using the following formula:

Where A and B are the upper and lower bounds.
When plotted it looks like this:

Source: https://en.wikipedia.org/wiki/Continuous_uniform_distribution#/media/File:Uniform_Distribution_PDF_SVG.svg
Log-Normal Distribution
The Log-Normal Distribution is much similar to the normal distribution except that the logarithm of the random variable is normally distributed. It can be defined as:

Where mu is the mean and sigma is the standard deviation.
When plotted it looks like the following:

Plot of the log-normal distribution for different values of sigma. Source: https://en.wikipedia.org/wiki/Log-normal_distribution#/media/File:PDF-log_normal_distributions.svg
Implementation
In order to model the probability distributions we can use the following code:
Normal Distribution
The Normal Distribution can be modelled using the NormalDistribution function:
normal = NormalDistribution(num_target_qubits = 5, mu=0, sigma=1, low=- 1, high=1)
Where the number of qubits is set to 5 and mu = 0 and sigma = 1.
After this the circuit has to be built using the following code:
normal.build(circuit,q)
The generated circuit used to model the normal distribution looks like this:

Uniform Distribution
The Uniform Distribution can be modelled using the UniformDistribution function:
uniform = UniformDistribution(num_target_qubits = 5,low=- 0, high=1)
Where the number if target qubits is 5 and the lower bound is 0 and the upper bound is 1
Next the circuit has to be built and the qubits measured:
uniform.build(circuit,q)
circuit.measure(q,c)
The generated circuit looks like the following:

This looks very much like a quantum random number generator because it is. Quantum devices ideally will be able to output random values that are uniformly distributed. However with noisy quantum devices they will not be perfectly uniformly distributed.
Log-Normal Distribution
The log-normal distribution can be modelled using the following function:
lognorm = LogNormalDistribution(num_target_qubits = 5, mu=0, sigma=1, low= 0, high=1)
Where the number of qubits is 5, mu is 0, and sigma is 1. The lower bound is 0 and the upper bound is 1.
After this the circuit is built and the qubits are measured:
lognorm.build(circuit,q)
circuit.measure(q,c)
The generated circuit looks like the following:

How to run the program
Copy and paste the code below in to a python file
Enter your API token in the IBMQ.enable_account('Insert API token here') part
Save and run
In order to get an API key you will have to register to the IBM quantum experience: https://quantum-computing.ibm.com
Code
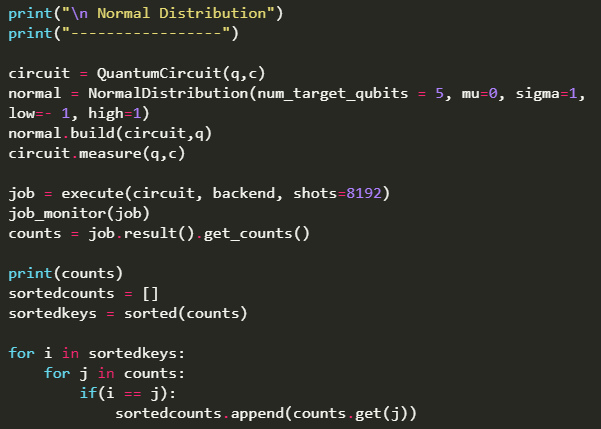
from qiskit import QuantumRegister, ClassicalRegister, BasicAer
import numpy as np
import matplotlib.pyplot as plt
from qiskit import QuantumCircuit, execute,IBMQ
from qiskit.tools.monitor import job_monitor
from qiskit.aqua.components.uncertainty_models import NormalDistribution,UniformDistribution,LogNormalDistribution

IBMQ.enable_account('Enter API key')
provider = IBMQ.get_provider(hub='ibm-q')

backend = provider.get_backend('ibmq_qasm_simulator')

q = QuantumRegister(5,'q')
c = ClassicalRegister(5,'c')

print("\n Normal Distribution")
print("-----------------")

circuit = QuantumCircuit(q,c)
normal = NormalDistribution(num_target_qubits = 5, mu=0, sigma=1, low=- 1, high=1)
normal.build(circuit,q)
circuit.measure(q,c)

job = execute(circuit, backend, shots=8192)
job_monitor(job)
counts = job.result().get_counts()

print(counts)
sortedcounts = []
sortedkeys = sorted(counts)

for i in sortedkeys:
    for j in counts:
        if(i == j):
            sortedcounts.append(counts.get(j))

plt.suptitle('Normal Distribution')
plt.plot(sortedcounts)
plt.show()

print("\n Uniform Distribution")
print("-----------------")

circuit = QuantumCircuit(q,c)
uniform = UniformDistribution(num_target_qubits = 5,low=- 0, high=1)
uniform.build(circuit,q)
circuit.measure(q,c)

job = execute(circuit, backend, shots=8192)
job_monitor(job)
counts = job.result().get_counts()

print(counts)

sortedcounts = []
sortedkeys = sorted(counts)

for i in sortedkeys:
    for j in counts:
        if(i == j):
            sortedcounts.append(counts.get(j))

plt.suptitle('Uniform Distribution')
plt.plot(sortedcounts)
plt.show()

print("\n Log-Normal Distribution")
print("-----------------")

circuit = QuantumCircuit(q,c)
lognorm = LogNormalDistribution(num_target_qubits = 5, mu=0, sigma=1, low= 0, high=1)
lognorm.build(circuit,q)
circuit.measure(q,c)

job = execute(circuit, backend, shots=8192)
job_monitor(job)
counts = job.result().get_counts()

print(counts)

sortedcounts = []
sortedkeys = sorted(counts)

for i in sortedkeys:
    for j in counts:
        if(i == j):
            sortedcounts.append(counts.get(j))

plt.suptitle('Log-Normal Distribution')
plt.plot(sortedcounts)
plt.show()

input()
Output

Output showing the probability distributions
Normal Distribution Plot

Graph plotted from the normal distribution variables
Uniform Distribution Plot

Graph Plotted from the uniform distribution variables
Log-Normal Distribution Plot

Graph Plotted from the Log-Normal distribution variables